

Advanced Features
Track, compare, and export video performance data with advanced filters, visual reports, and one-click dashboard saves.
All video analytics metrics in Gumlet come with powerful tools that make it easy to explore, compare, and export your video performance data.
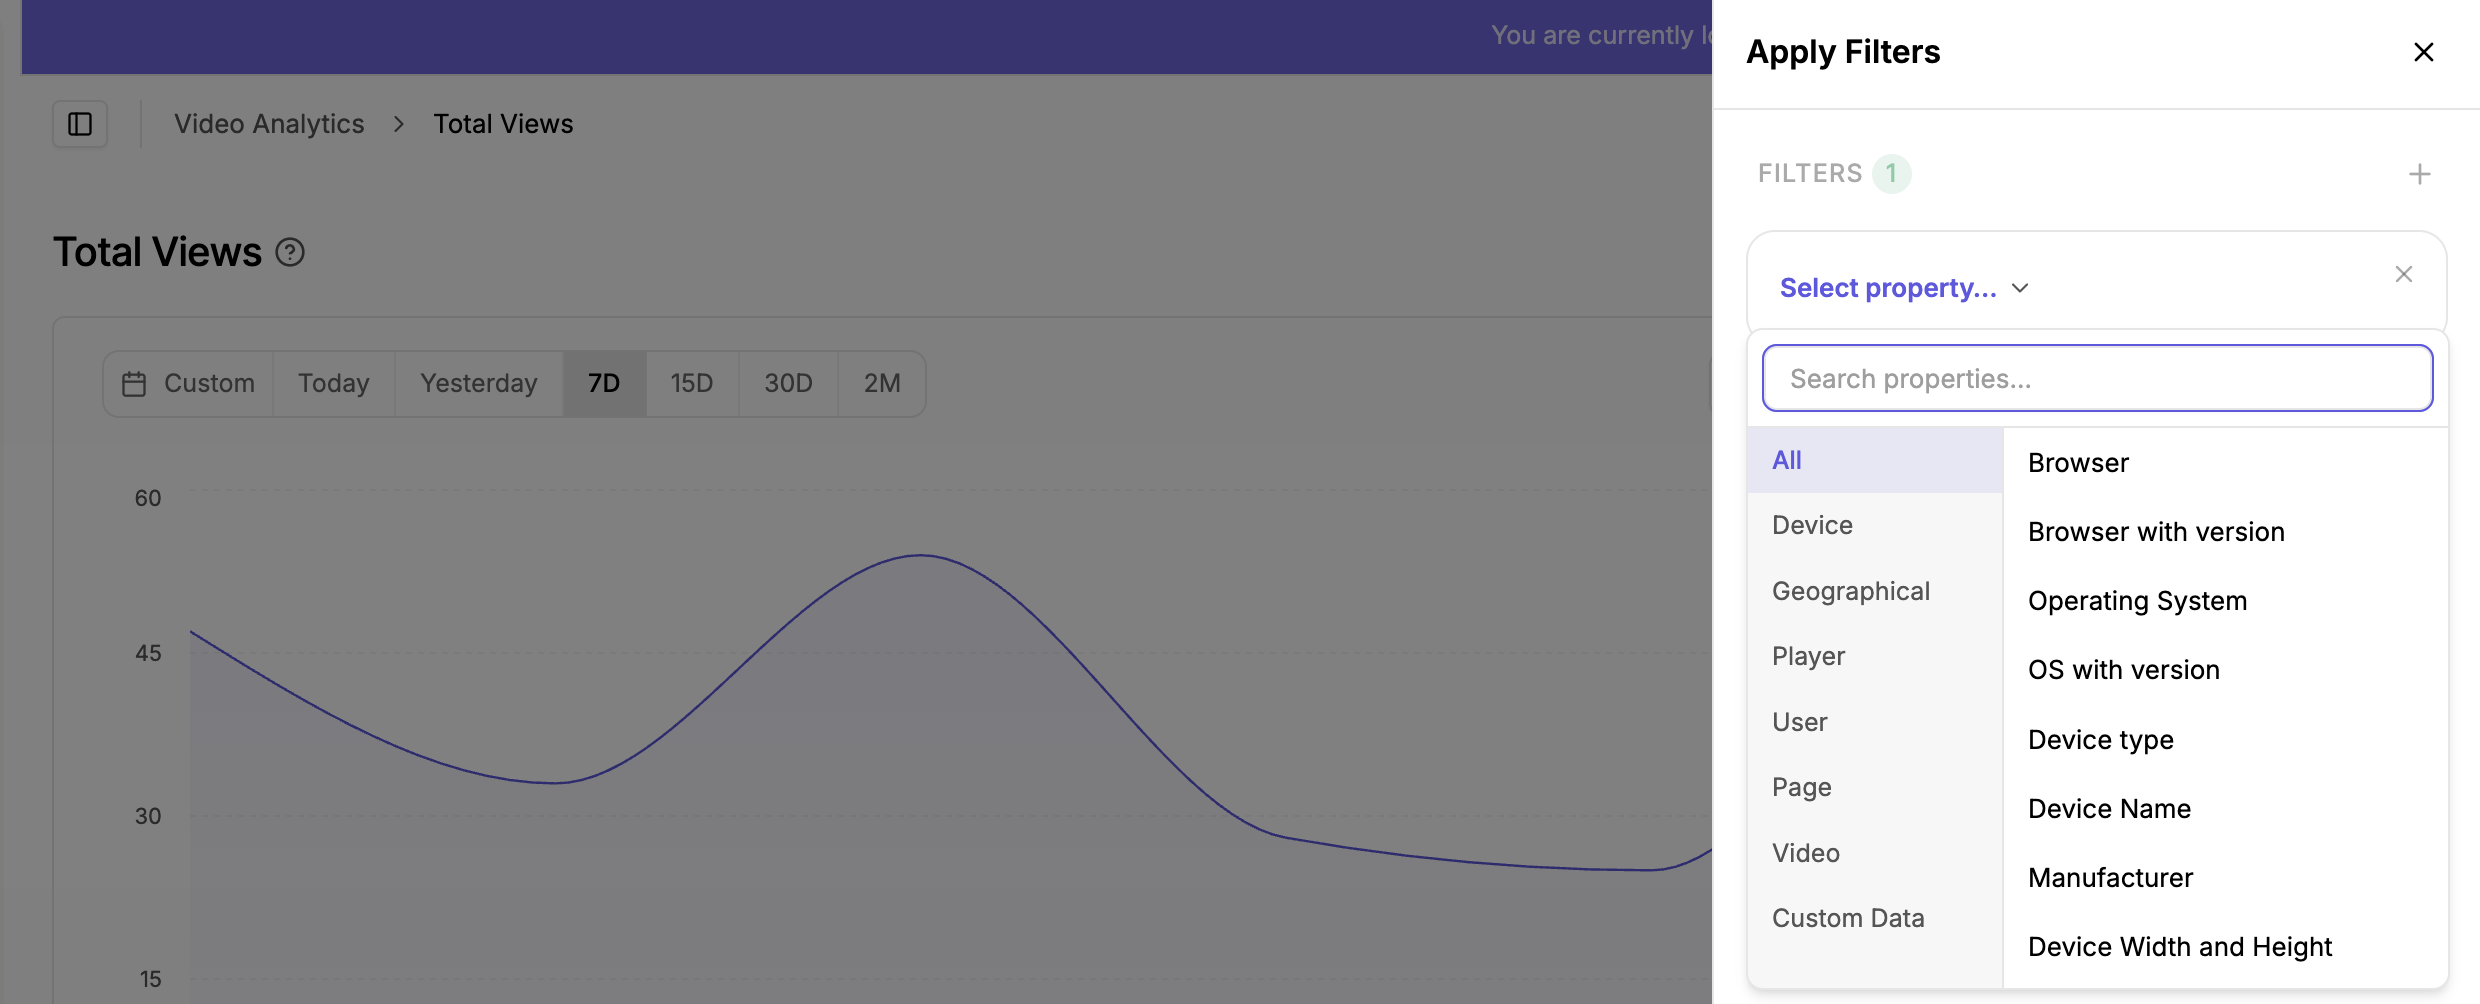
Filters
Quickly narrow down video analytics by applying filters such as:
- Video details
- Device
- Viewer demographics
- User info
- Custom data (passed via the iframe)
Grouping
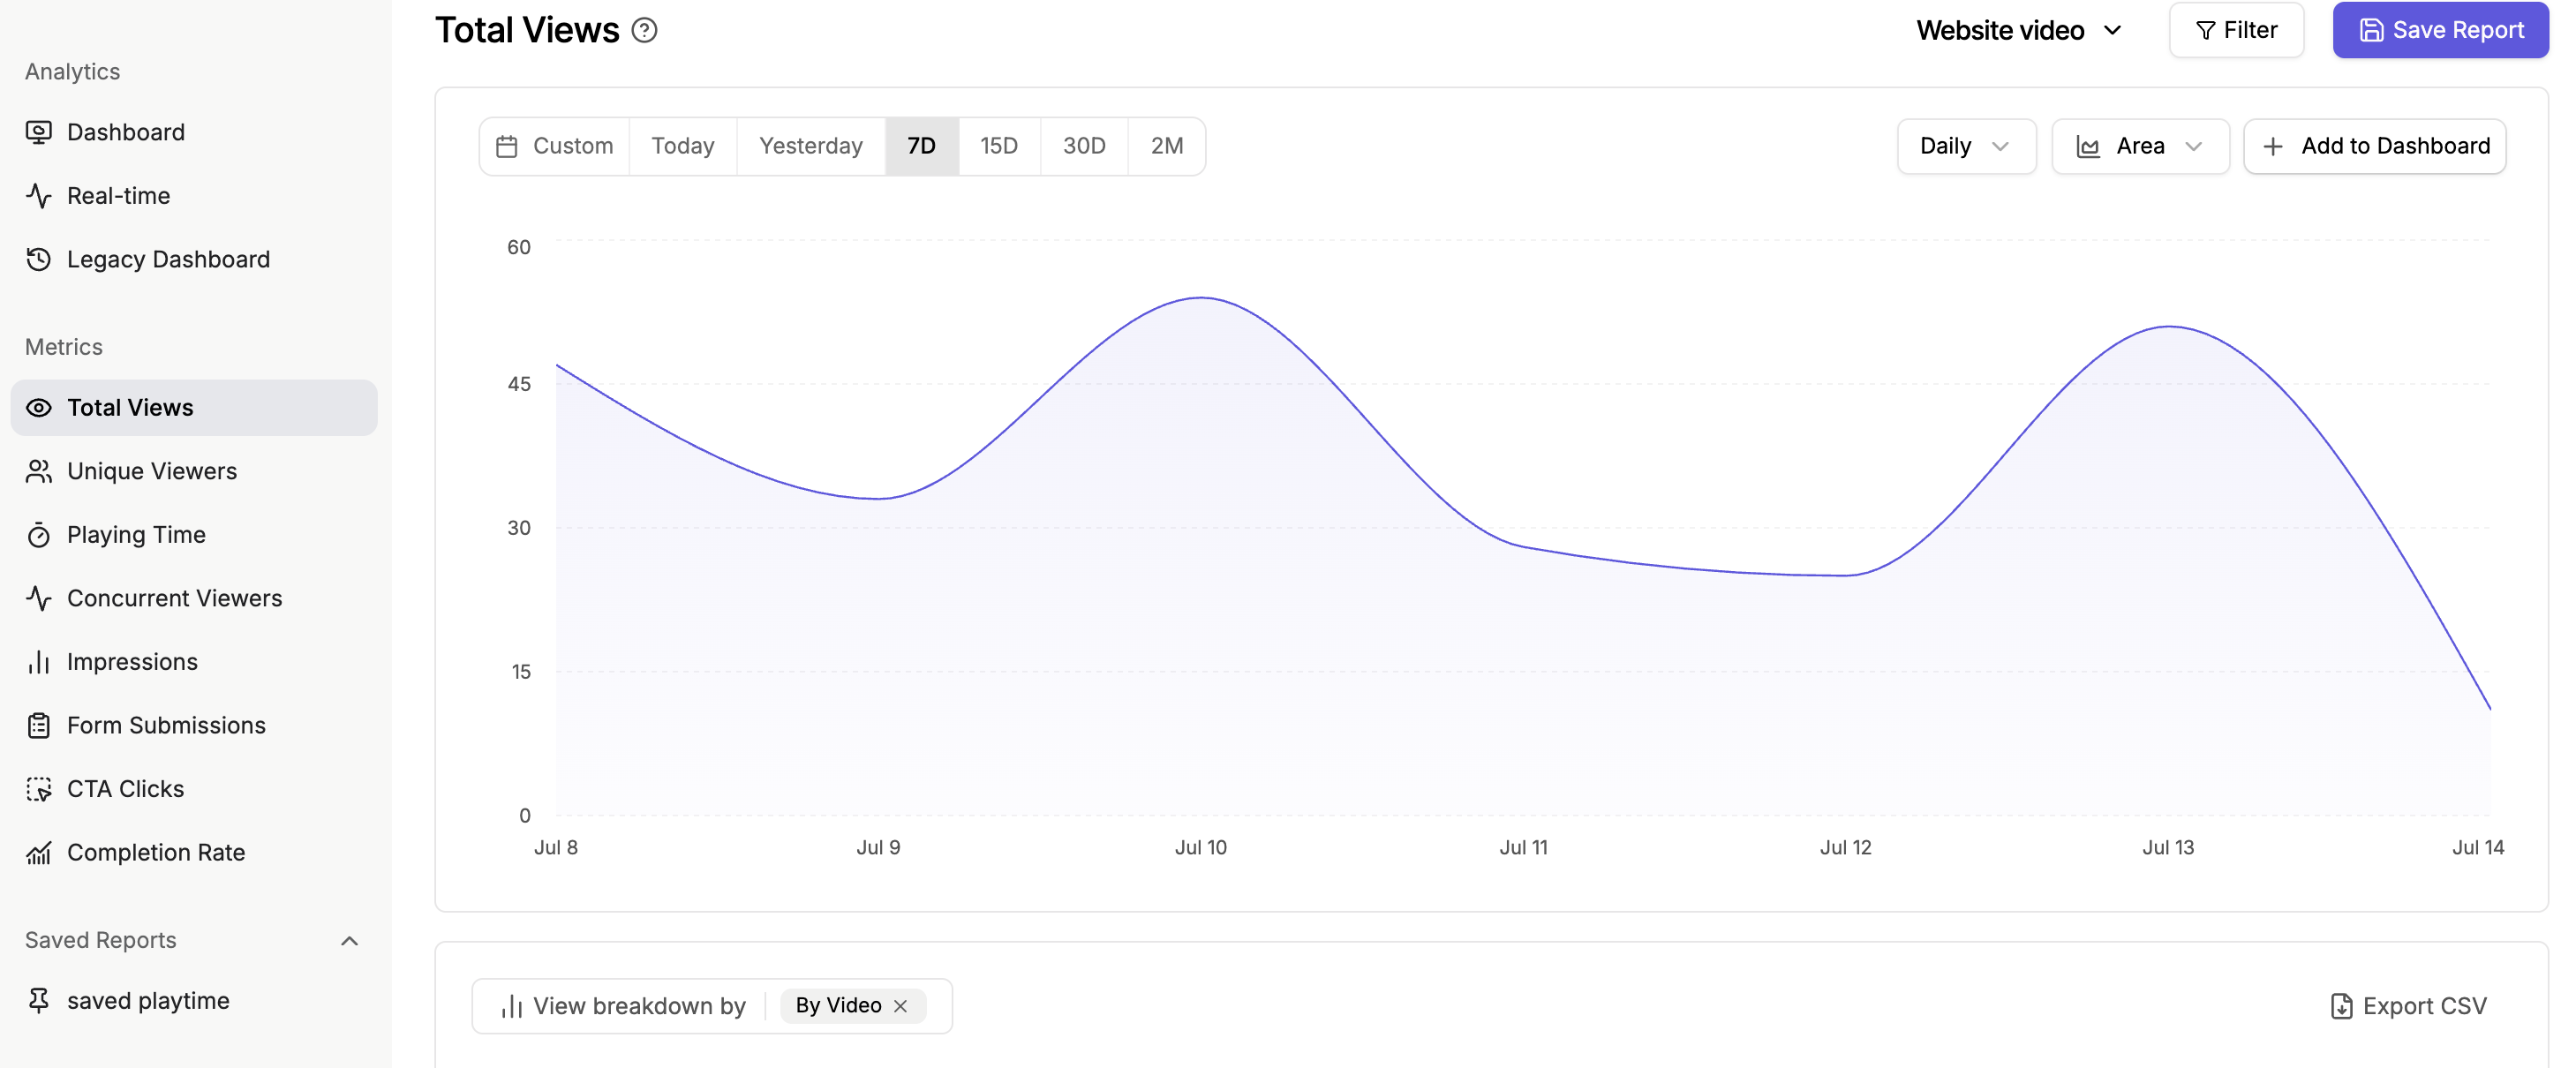
Compare video metrics by duration range
- Daily
- Weekly
- Monthly
Graph types
Visualize your video analytics with flexible chart options, including:
- Line charts for viewing trends over time
- Bar charts for side‑by‑side comparisons
- Area charts to highlight overall volume and change over time
CSV exports
Export your video analytics metrics as CSV files for deeper analysis in spreadsheet tools or external BI and data visualization platforms.
Save to dashboard
Pin important video performance reports to your analytics dashboard for quick access and ongoing monitoring.
Save report
Save video analytics reports so you can track historical performance, compare time periods, and revisit key insights whenever you need.
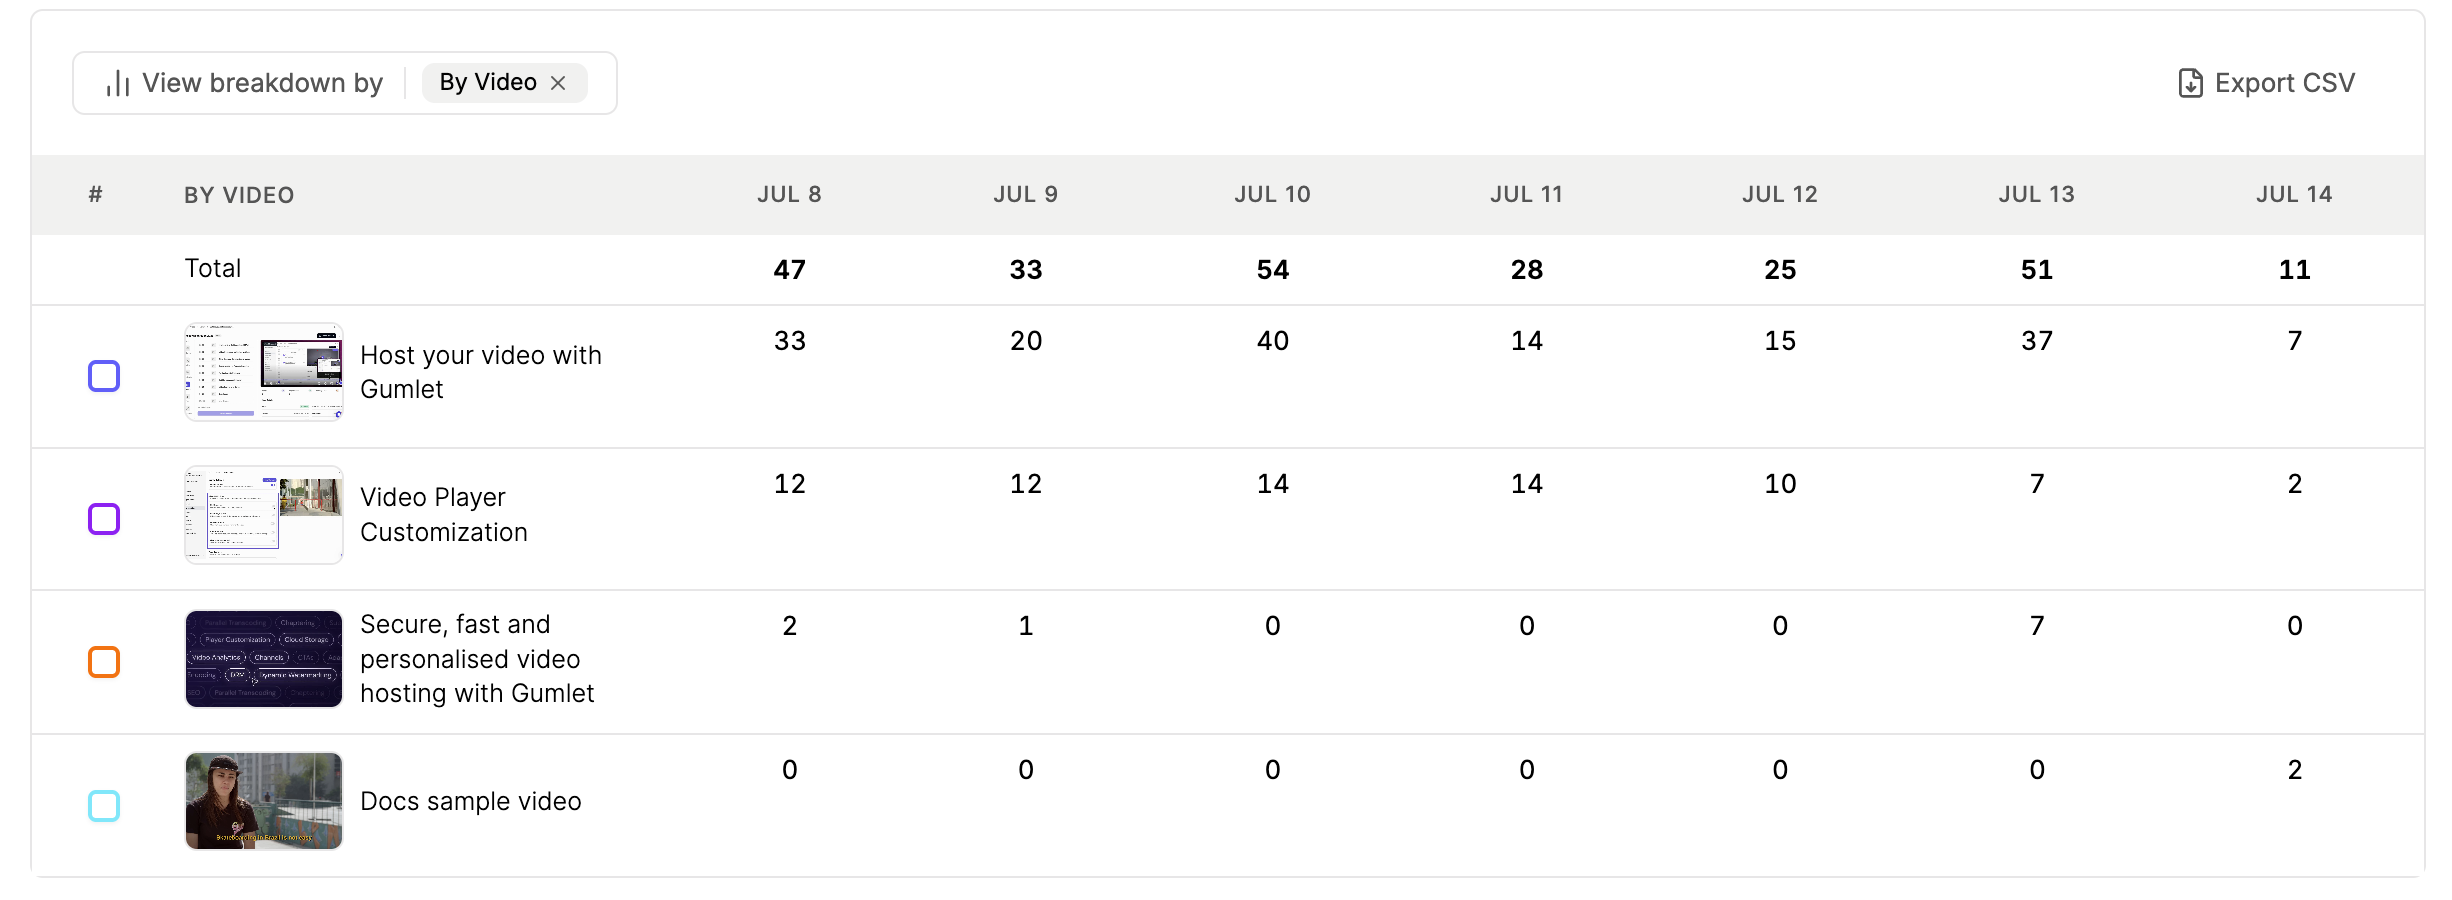
Breakdown
Go deeper into video performance with detailed breakdowns across:
- Video details
- Device type
- Viewer demographics
- User info
- Browser and OS
- Custom data
Updated about 1 month ago