Video Analytics
Understand how your viewers are watching your videos.
The deep insights from your videos put you ahead of your audience's needs. Gumlet's advanced video analytics provide the insights that enable you to enhance your content, increase engagement, and delight your audience.
Analytics page for a given Video
You can access the analytics page from two places:
-
Right from the video CMS table

Click on the analytics icon in the CMS
-
From the video settings page
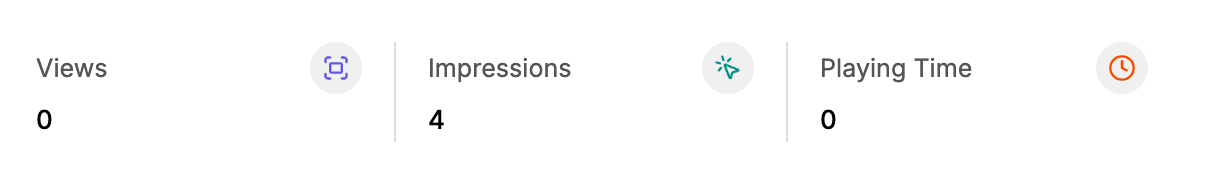
Click on the quick analytics strip.
The metrics you can deep dive into with Video Analytics:
- Video heatmap
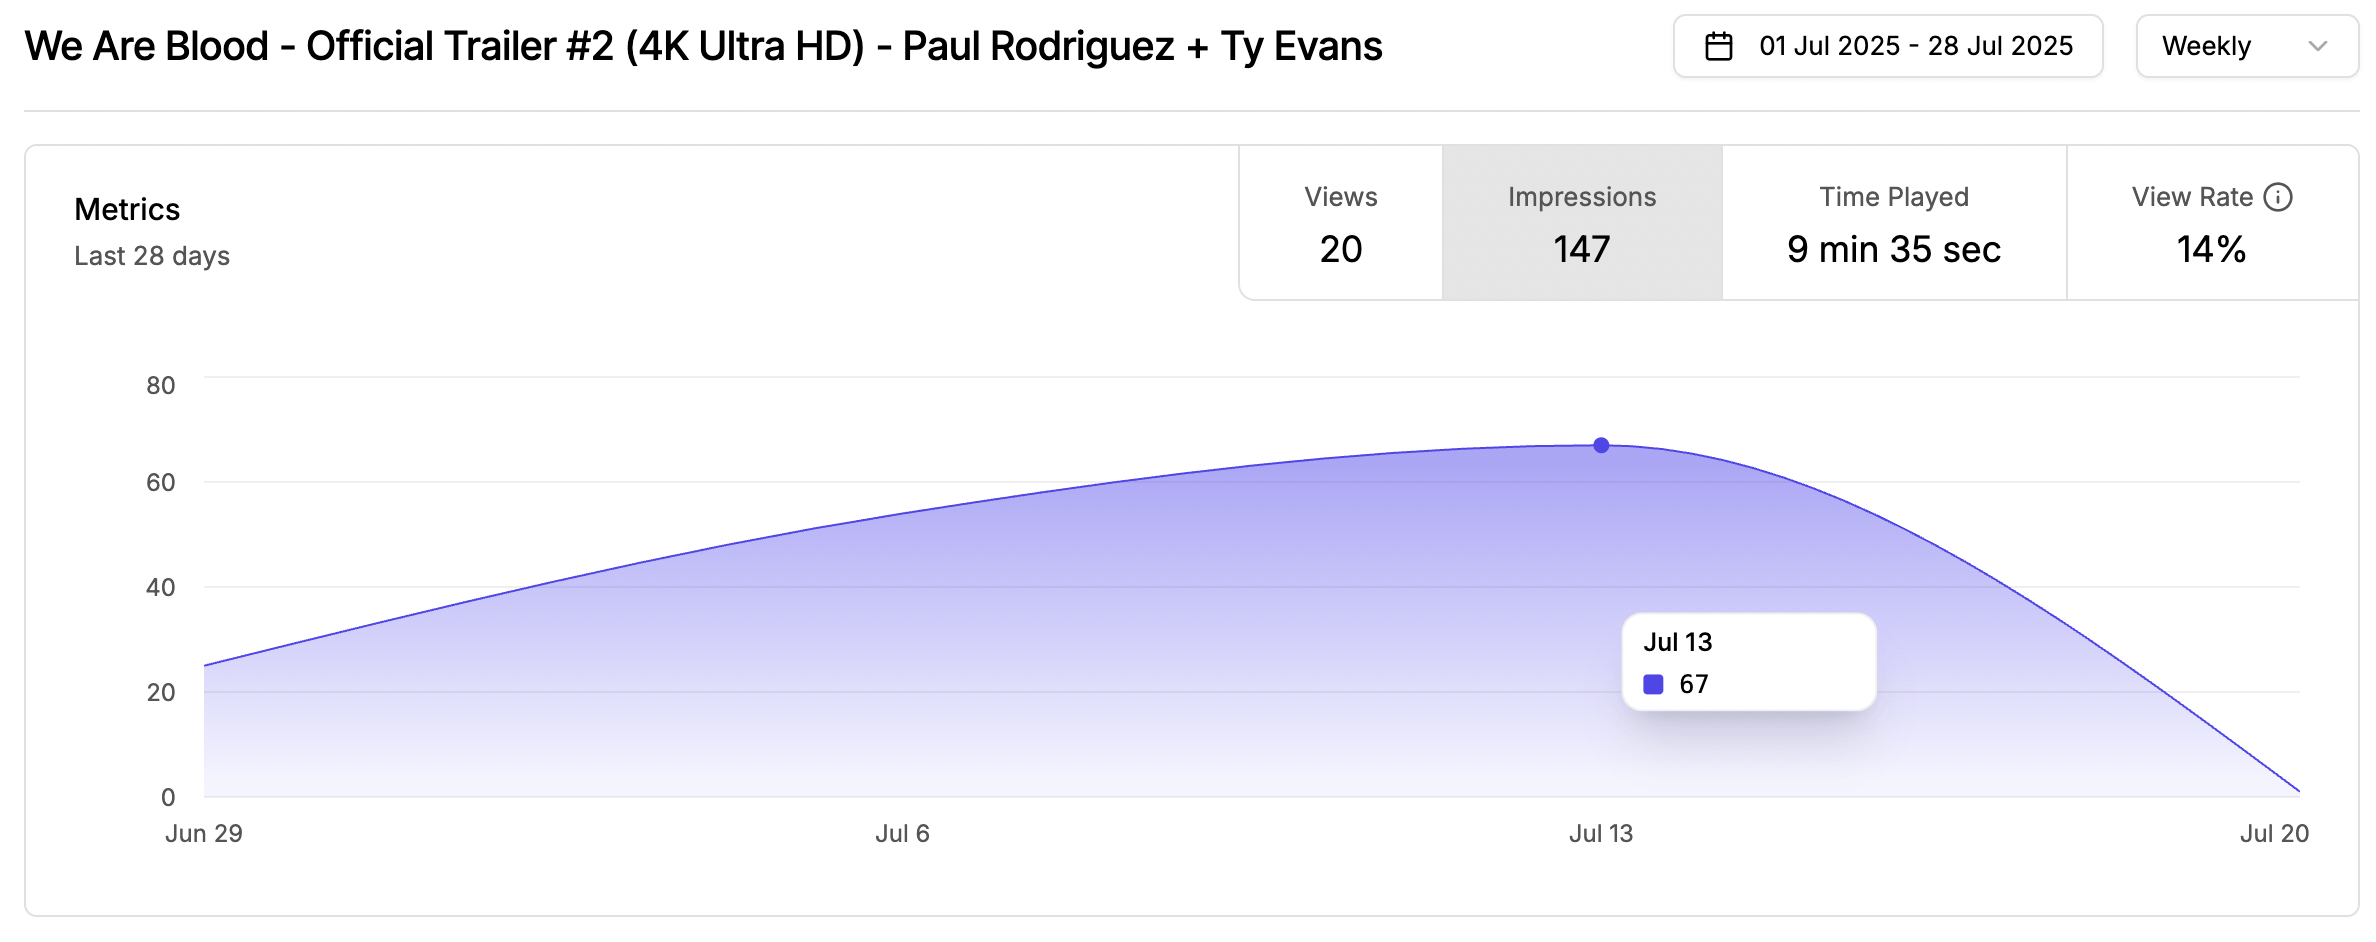
- Views on a daily, weekly, and monthly basis
- Total impression on a particular date range
- Total time played grouped in days/weeks/months
- Average view rate -> views/impressions, how many video plays against the video loads
- Geography of your audience, i.e., cities or countries
- Top pages (referrers) from where your video is being watched
- Top browsers and devices your audience uses for watching your content
Gumlet collects data to help creators understand how their videos are doing from multiple angles, such as geographical distribution, platform (domain) distribution, device distribution, etc.
Video Heatmap
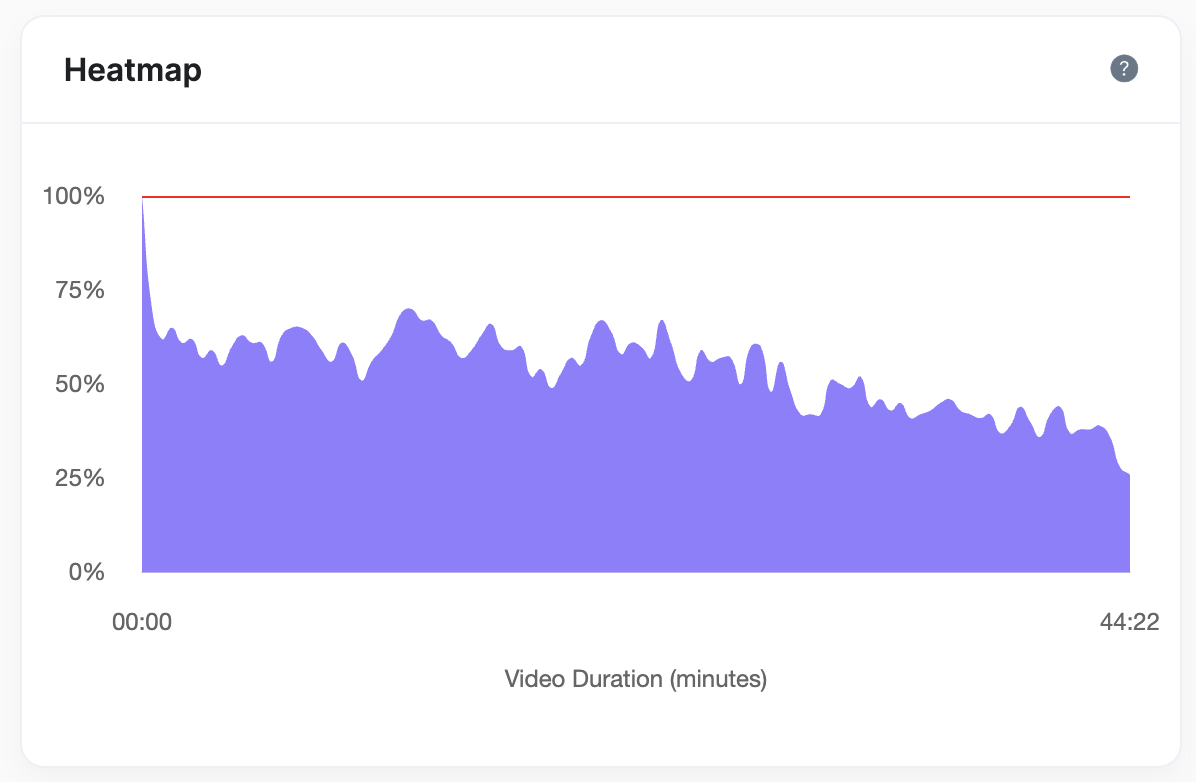
A video heatmap is an advanced analytics metric that helps you understand how your audience views your video. In a nutshell, it shows when your audience drops or skips the content.
How to read the graph
- The x-axis is the duration of the video.
- The y-axis represents the percentage of total views.
- The graph depicts the % of the total views watching a fragment of the video
- e.g.- when a video is started, 100% of views have at least 1 second watched, so 1st fragment is 100%
- e.g.- when there is an upside from the previous fragment, it means the user would have skipped the previous segment
- e.g.- when there is a downside in the following fragment, it means the user skipped that segment or left the video (stopped/reloaded)
Things to consider
- The graph is calculated on the total number of views of the video.
- The heatmap data remains unchanged when you modify the date range in the date picker on the analytics page.
Updated 5 months ago