

Video Analytics
Detailed video insights to understand your audience and improve your content delivery.
Gumlet provides comprehensive analytics data to help you understand who is viewing your videos, how they are engaging with the content, their geographic location, the devices they are using, and much more.
Dashboard
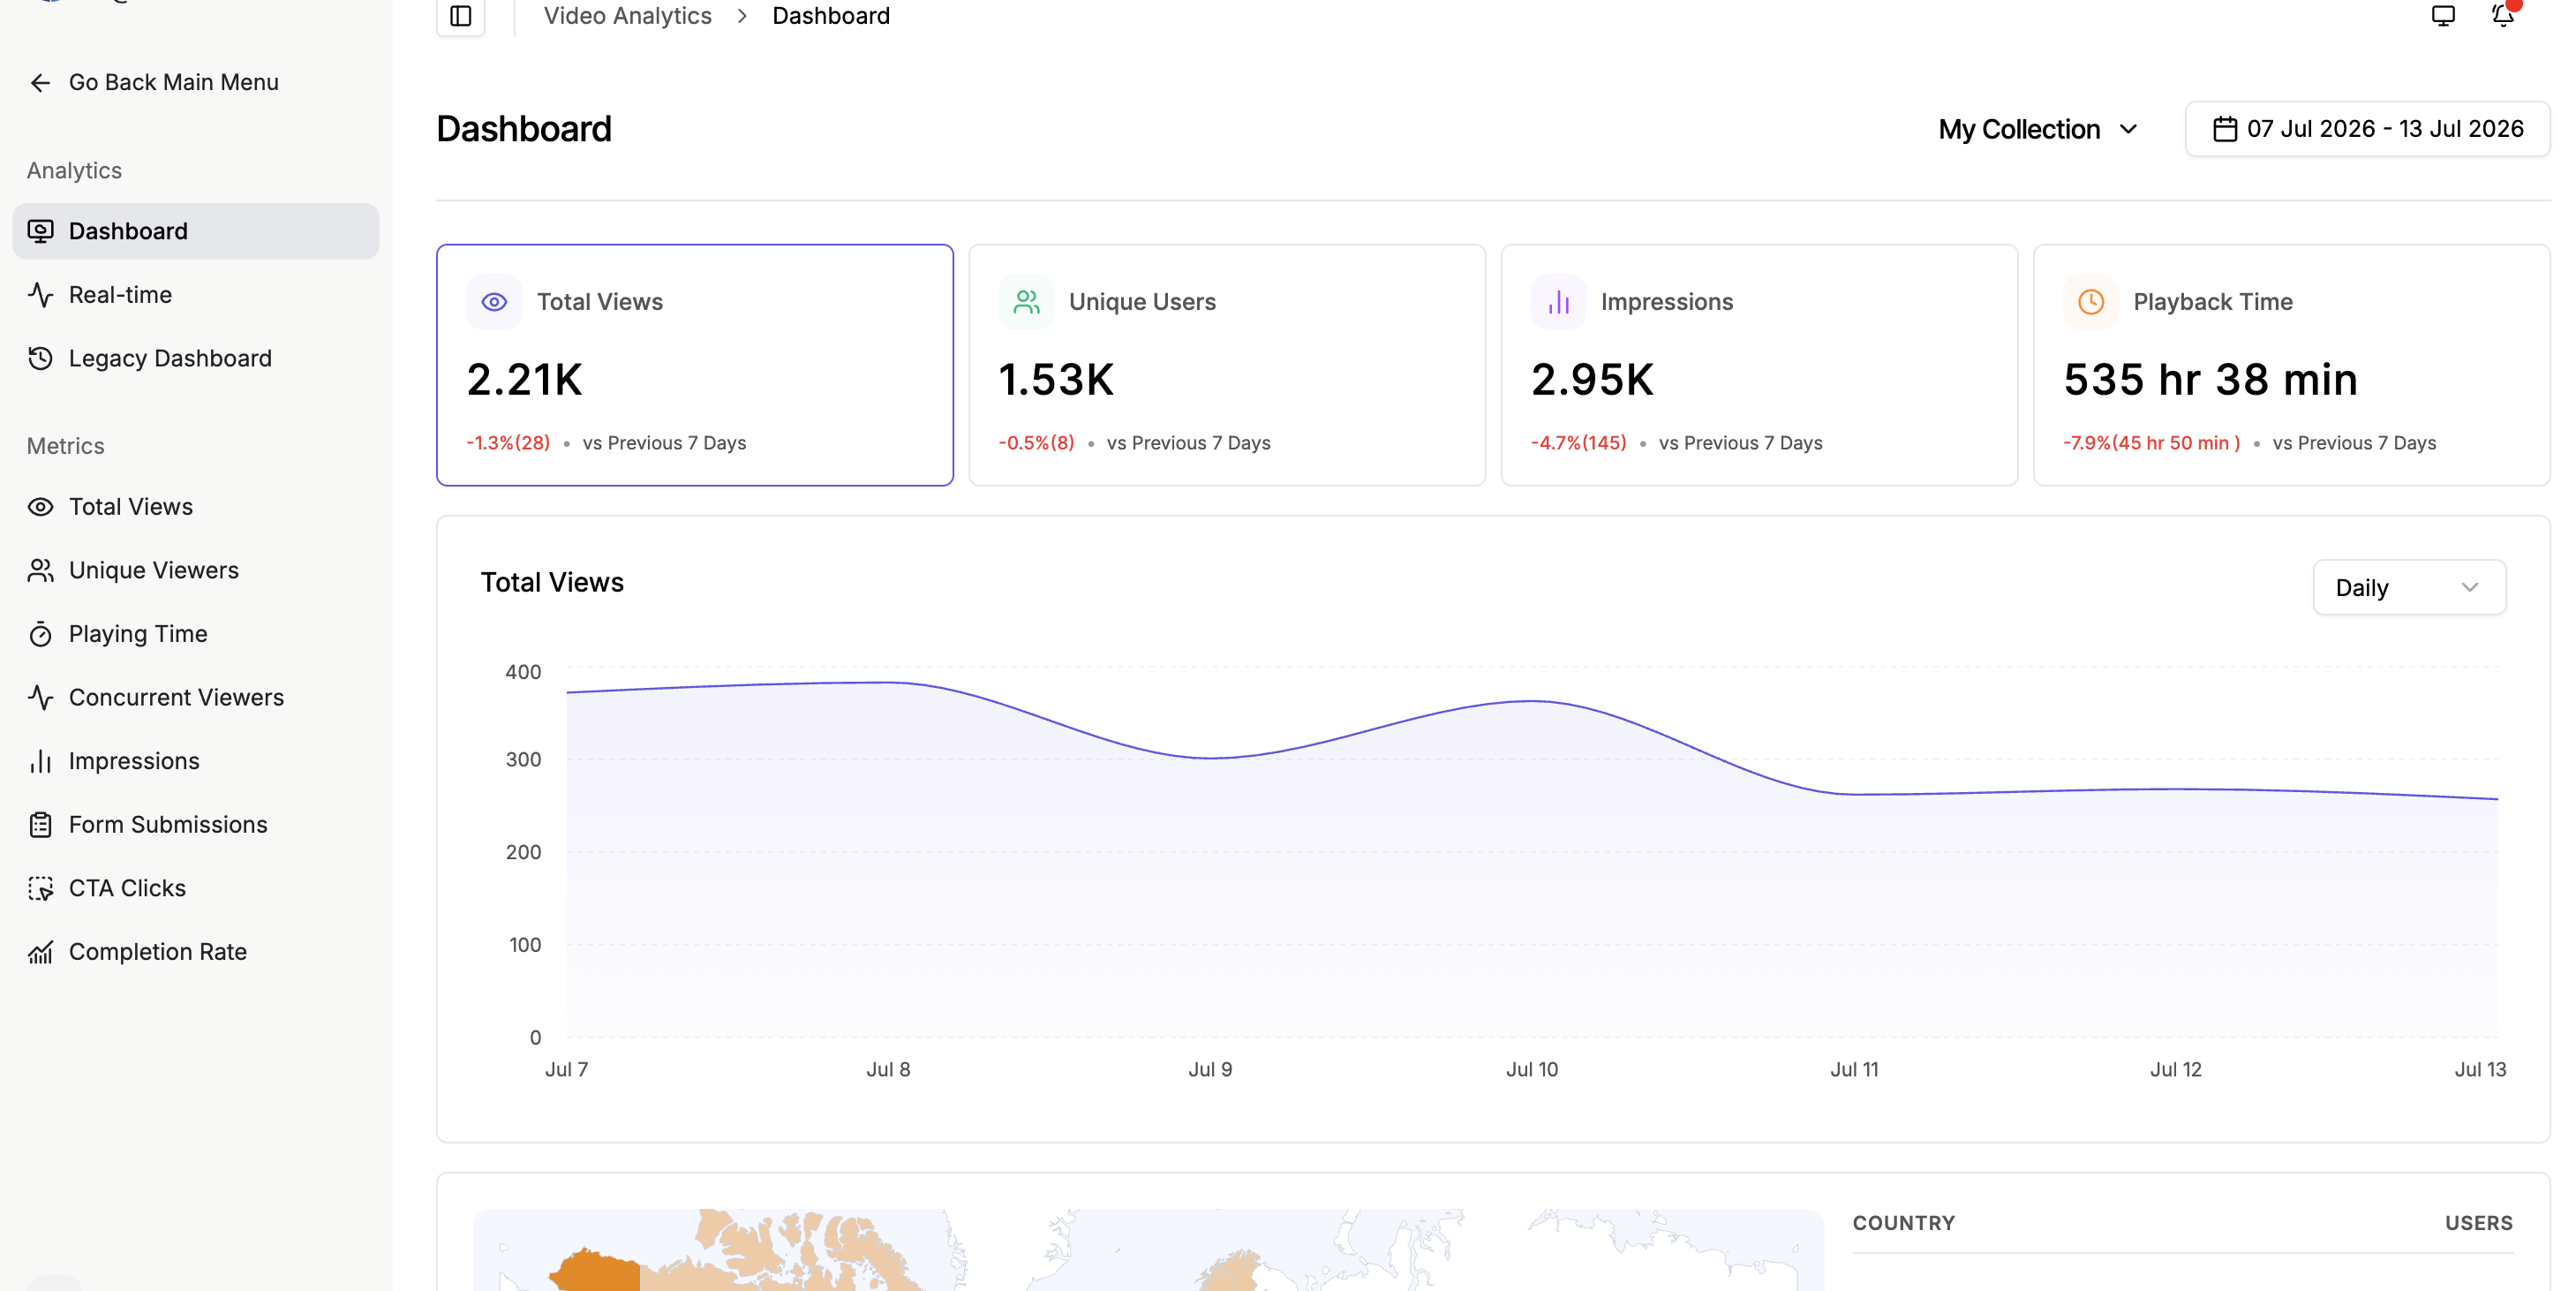
A comprehensive dashboard is automatically created for all users with the following reports:
- Impression graphs
- Total Views
- Unique users tracking
- Playback time graphs
- Geographical map visualization
- Top videos ranking
- Custom reports (if added)
Real-time Dashboard
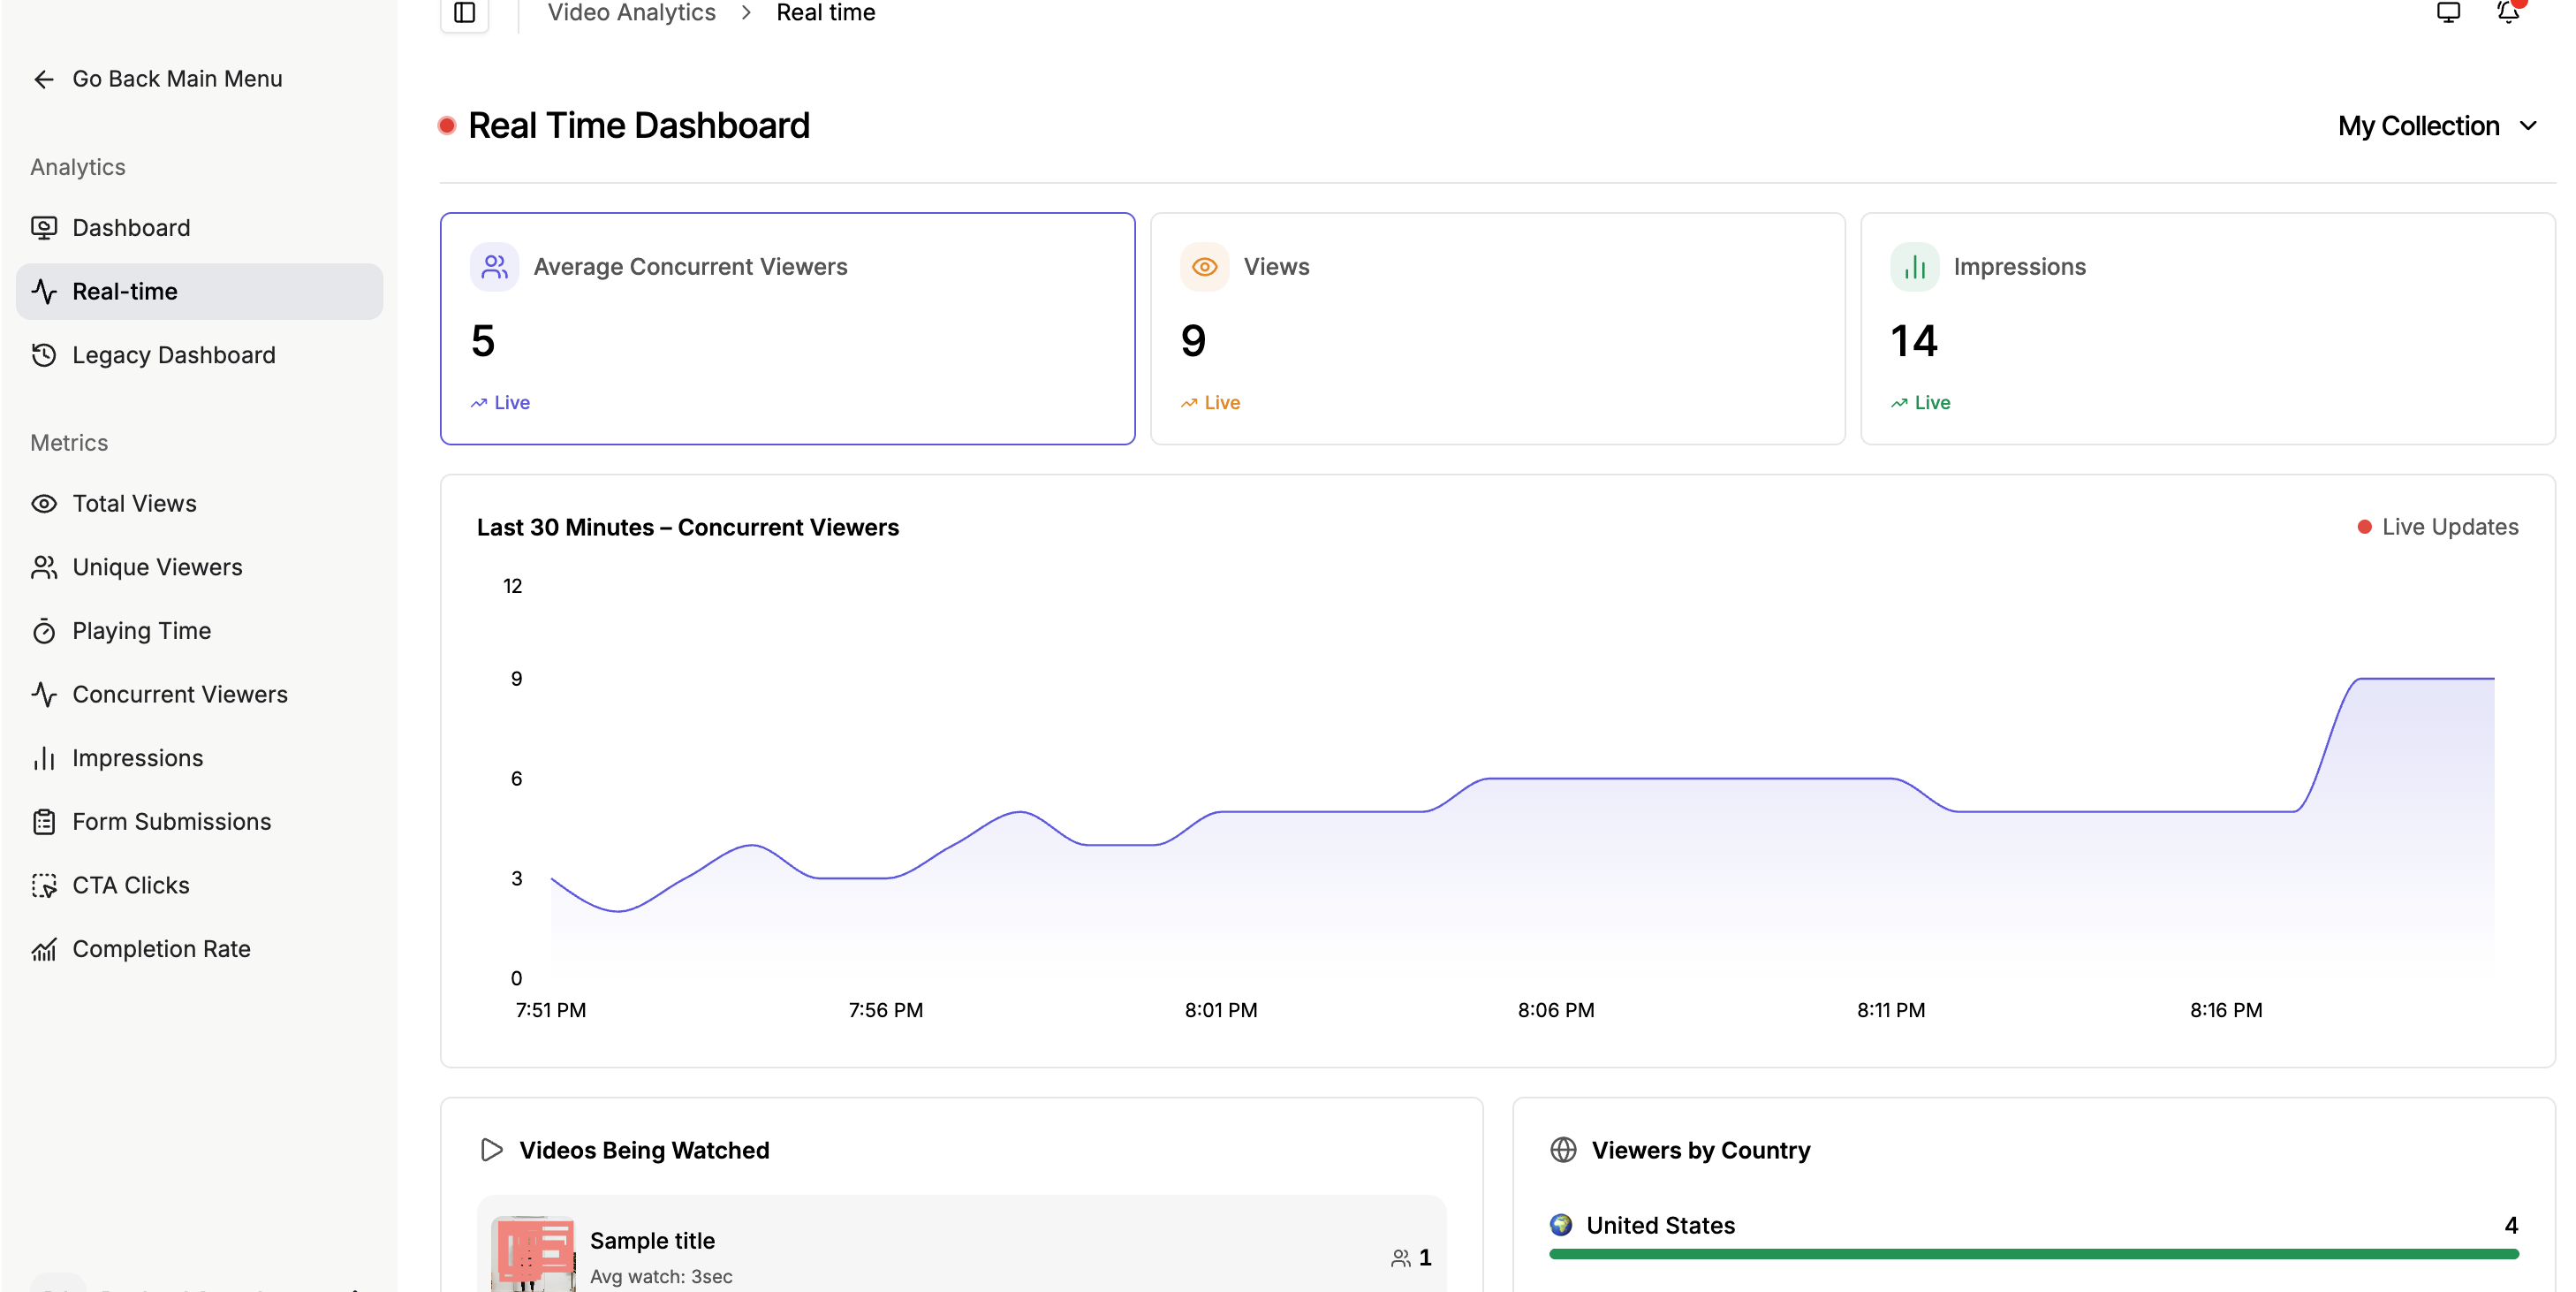
Monitor live performance with auto-refreshing data including:
- Average concurrent viewers
- View and impressions metrics
- Videos currently being watched
- Views by country breakdown
- Device analytics
- Browser analytics
- Data from the last 30 minutes (auto-refreshes)
The above dashboards provide insights into real-time and historical trends. Additionally, we offer detailed video metrics to help you create better videos, boost engagement, and enhance the viewer experience.
Video Metrics
Here are the metrics dashboards that you can refer to:
- Total Views
- Unique Viewers
- Playing Time
- Concurrent Viewer
- Impressions
- Form Submissions
- CTA (call to action) Clicks
- Completion Rate
Metric Features
All metrics come equipped with powerful tools:
- Filters - Narrow down data by specific criteria
- Grouping - Organize metrics by different dimensions
- Breakdown - Analyze metrics across categories
- Graph types - Multiple visualization options
- CSV exports - Download data for external analysis
- Save to dashboard - Pin important reports to your dashboard
- Save report - Store reports for future reference
Learn more about advanced features available with each metric here.
Updated 29 days ago