Analytics Dashboard
Metrics to monitor image delivery
You can monitor your image delivery performance with our analytics dashboard. It can be accessed by visiting Analytics tab on Gumlet dashboard.
Metrics
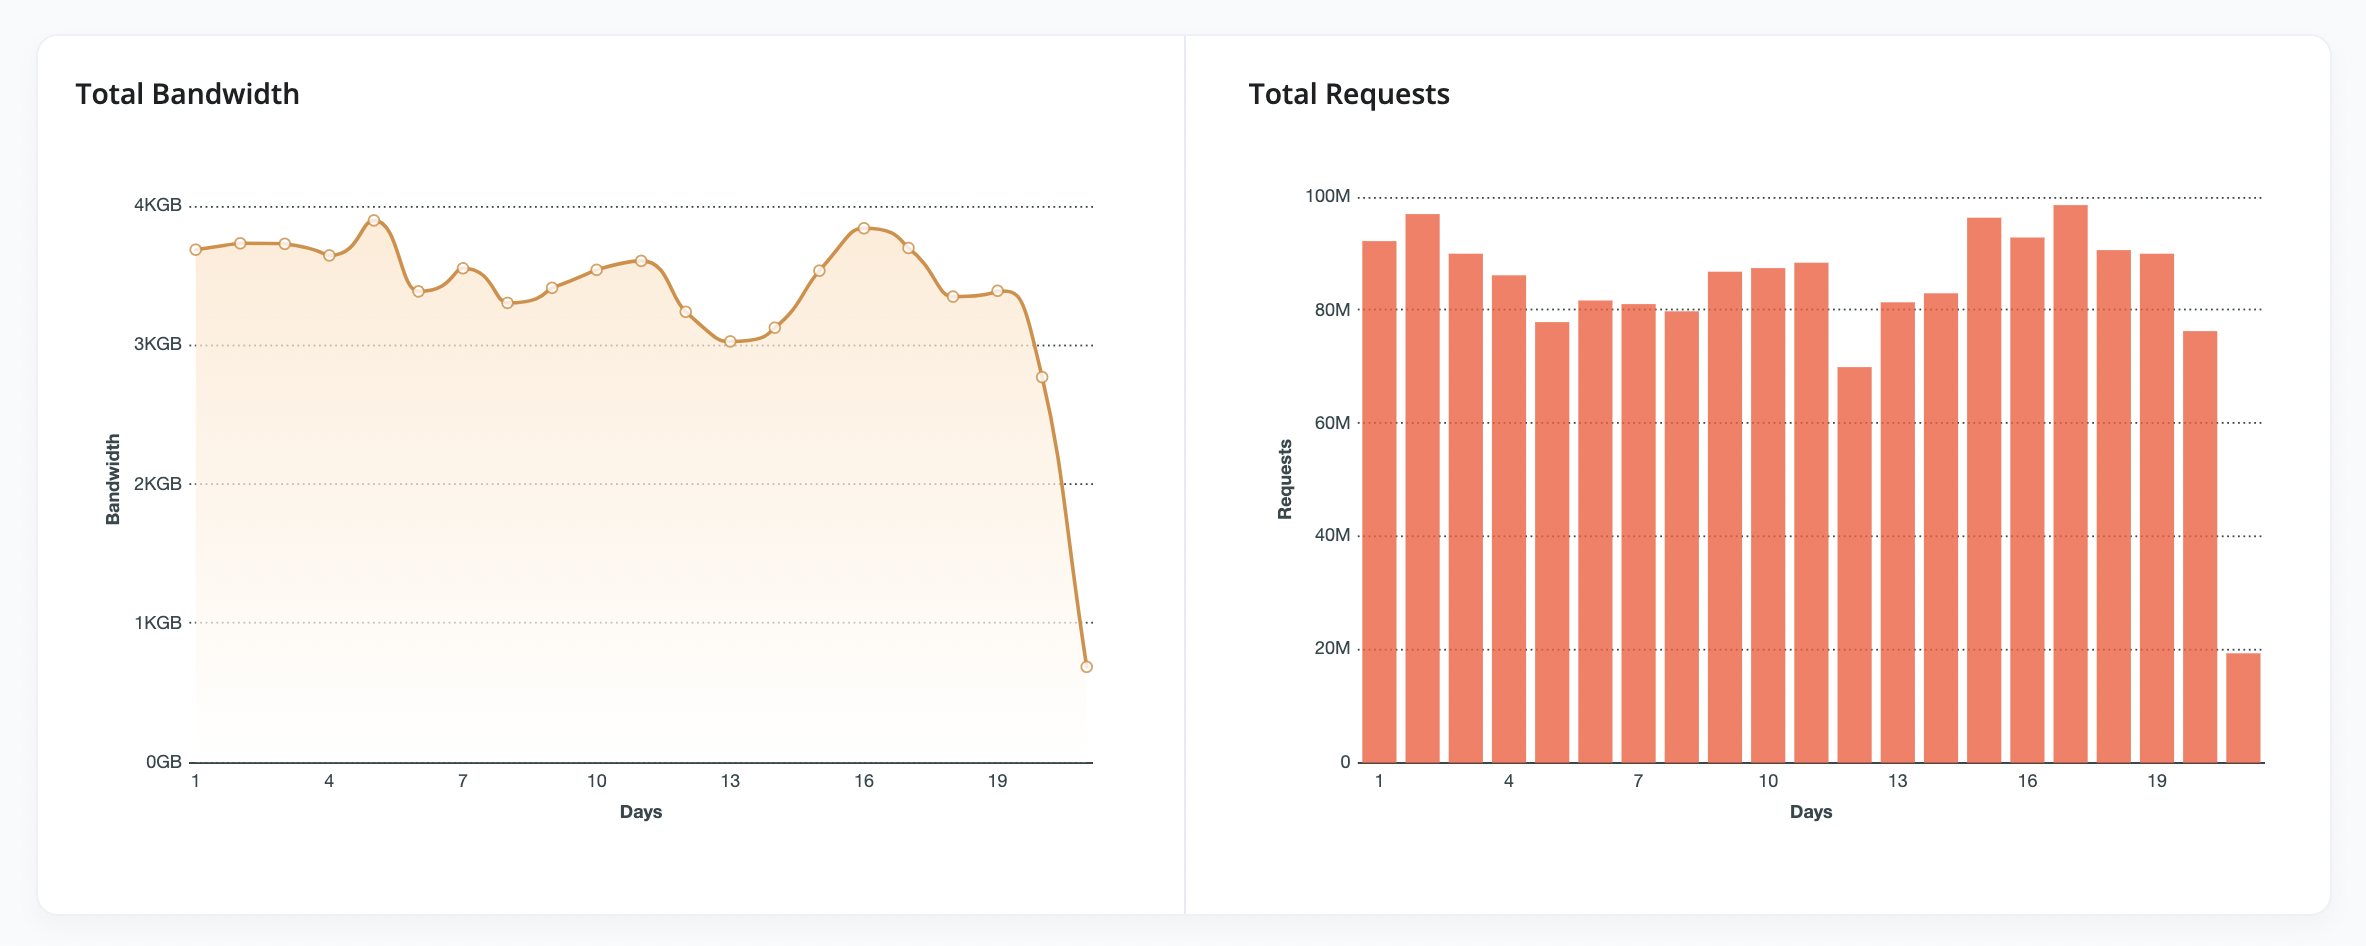
You can check all important metrics like bandwidth consumed and the number of requests at a glance on the dashboard. The panel allows you to switch analytics to a different month or filter it by a specific source.

- Bandwidth Consumed: Indicates the Gumlet CDN bandwidth usage for delivering your optimized images. 1 GB bandwidth consumed = 1 Gumlet credit.
- Bandwidth Savings: This indicates how much bandwidth is saved due to image optimization. Without Gumlet your website or app would have used this much more bandwidth. Every GB of bandwidth saved contributes to saving electricity 2 kWh! Let's make our planet greener 🌎!
- Requests: The number of images and other files served via Gumlet CDN.
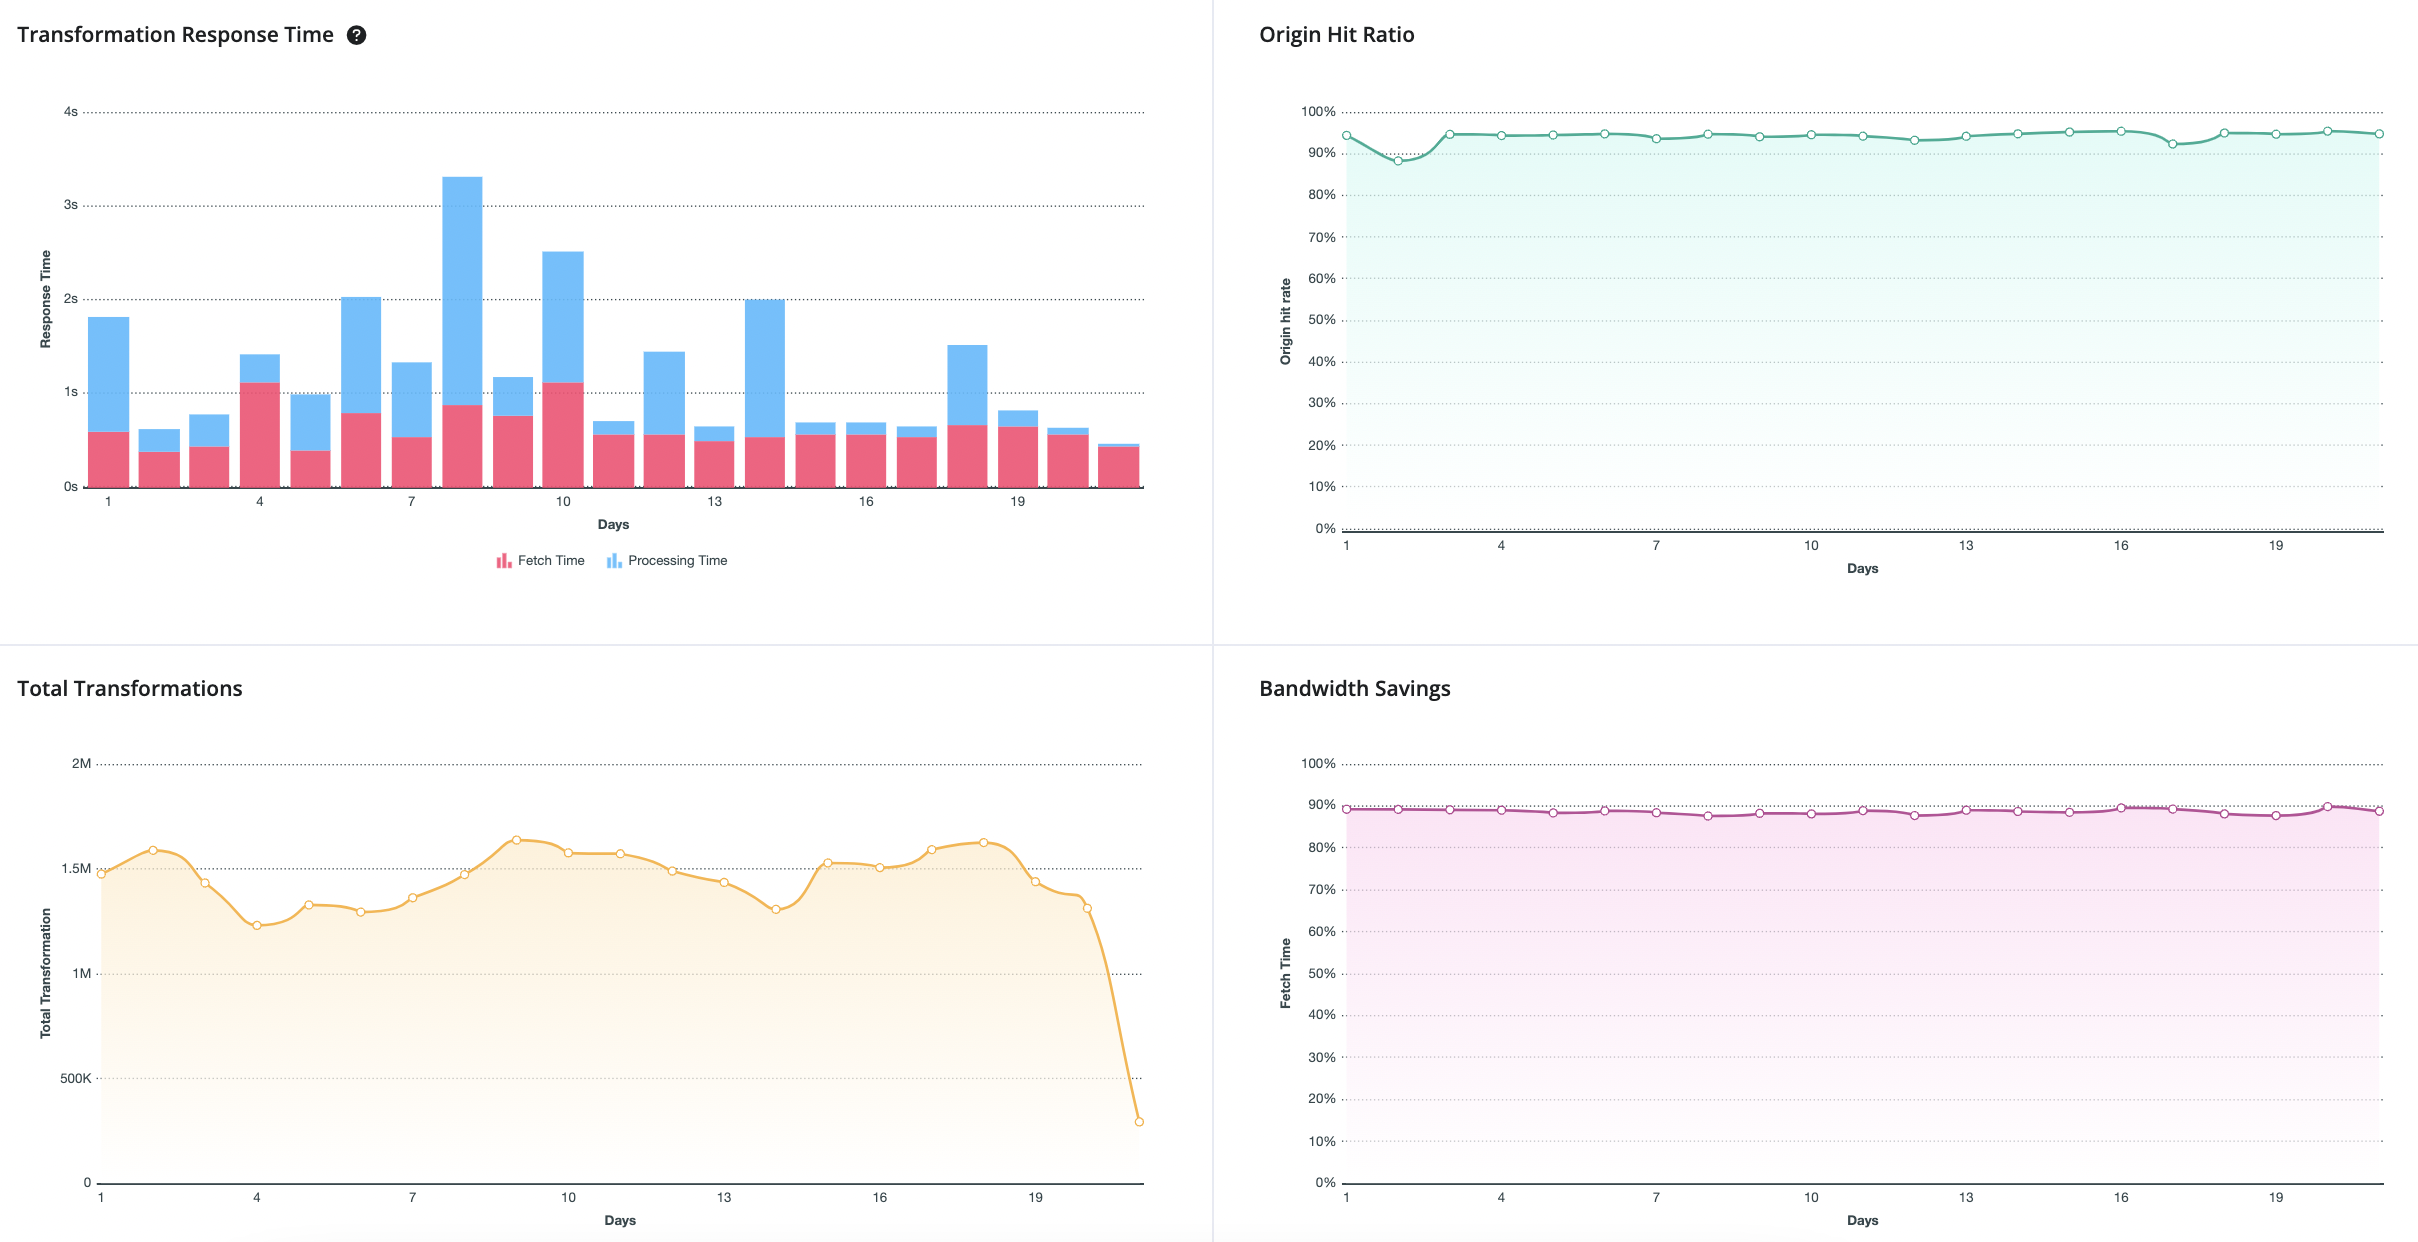
- Transformations: The number of image variants created and cached by Gumlet for your website.
Network
It shows daily bandwidth consumption and number of requests received by our CDN. This bandwidth consumption decides your invoice amount.

Transformations
This panel shows information about how uncached requests were handled. For example, if width=600 is requested but it's not available in the cache, we need to perform a transformation on the master image.
- Total Transformations
- Total number of derivatives made from master images
- Transformation Response Time
- How long did it take for our server to process the image
- This time also includes time to fetch the image from origin hence we display a stacked graph
- Origin Cache Hit Ratio
- How many percent of total transform requests could be served from the origin cache
- Bandwidth Savings
- How many percent of bandwidth saved using gumlet

CDN
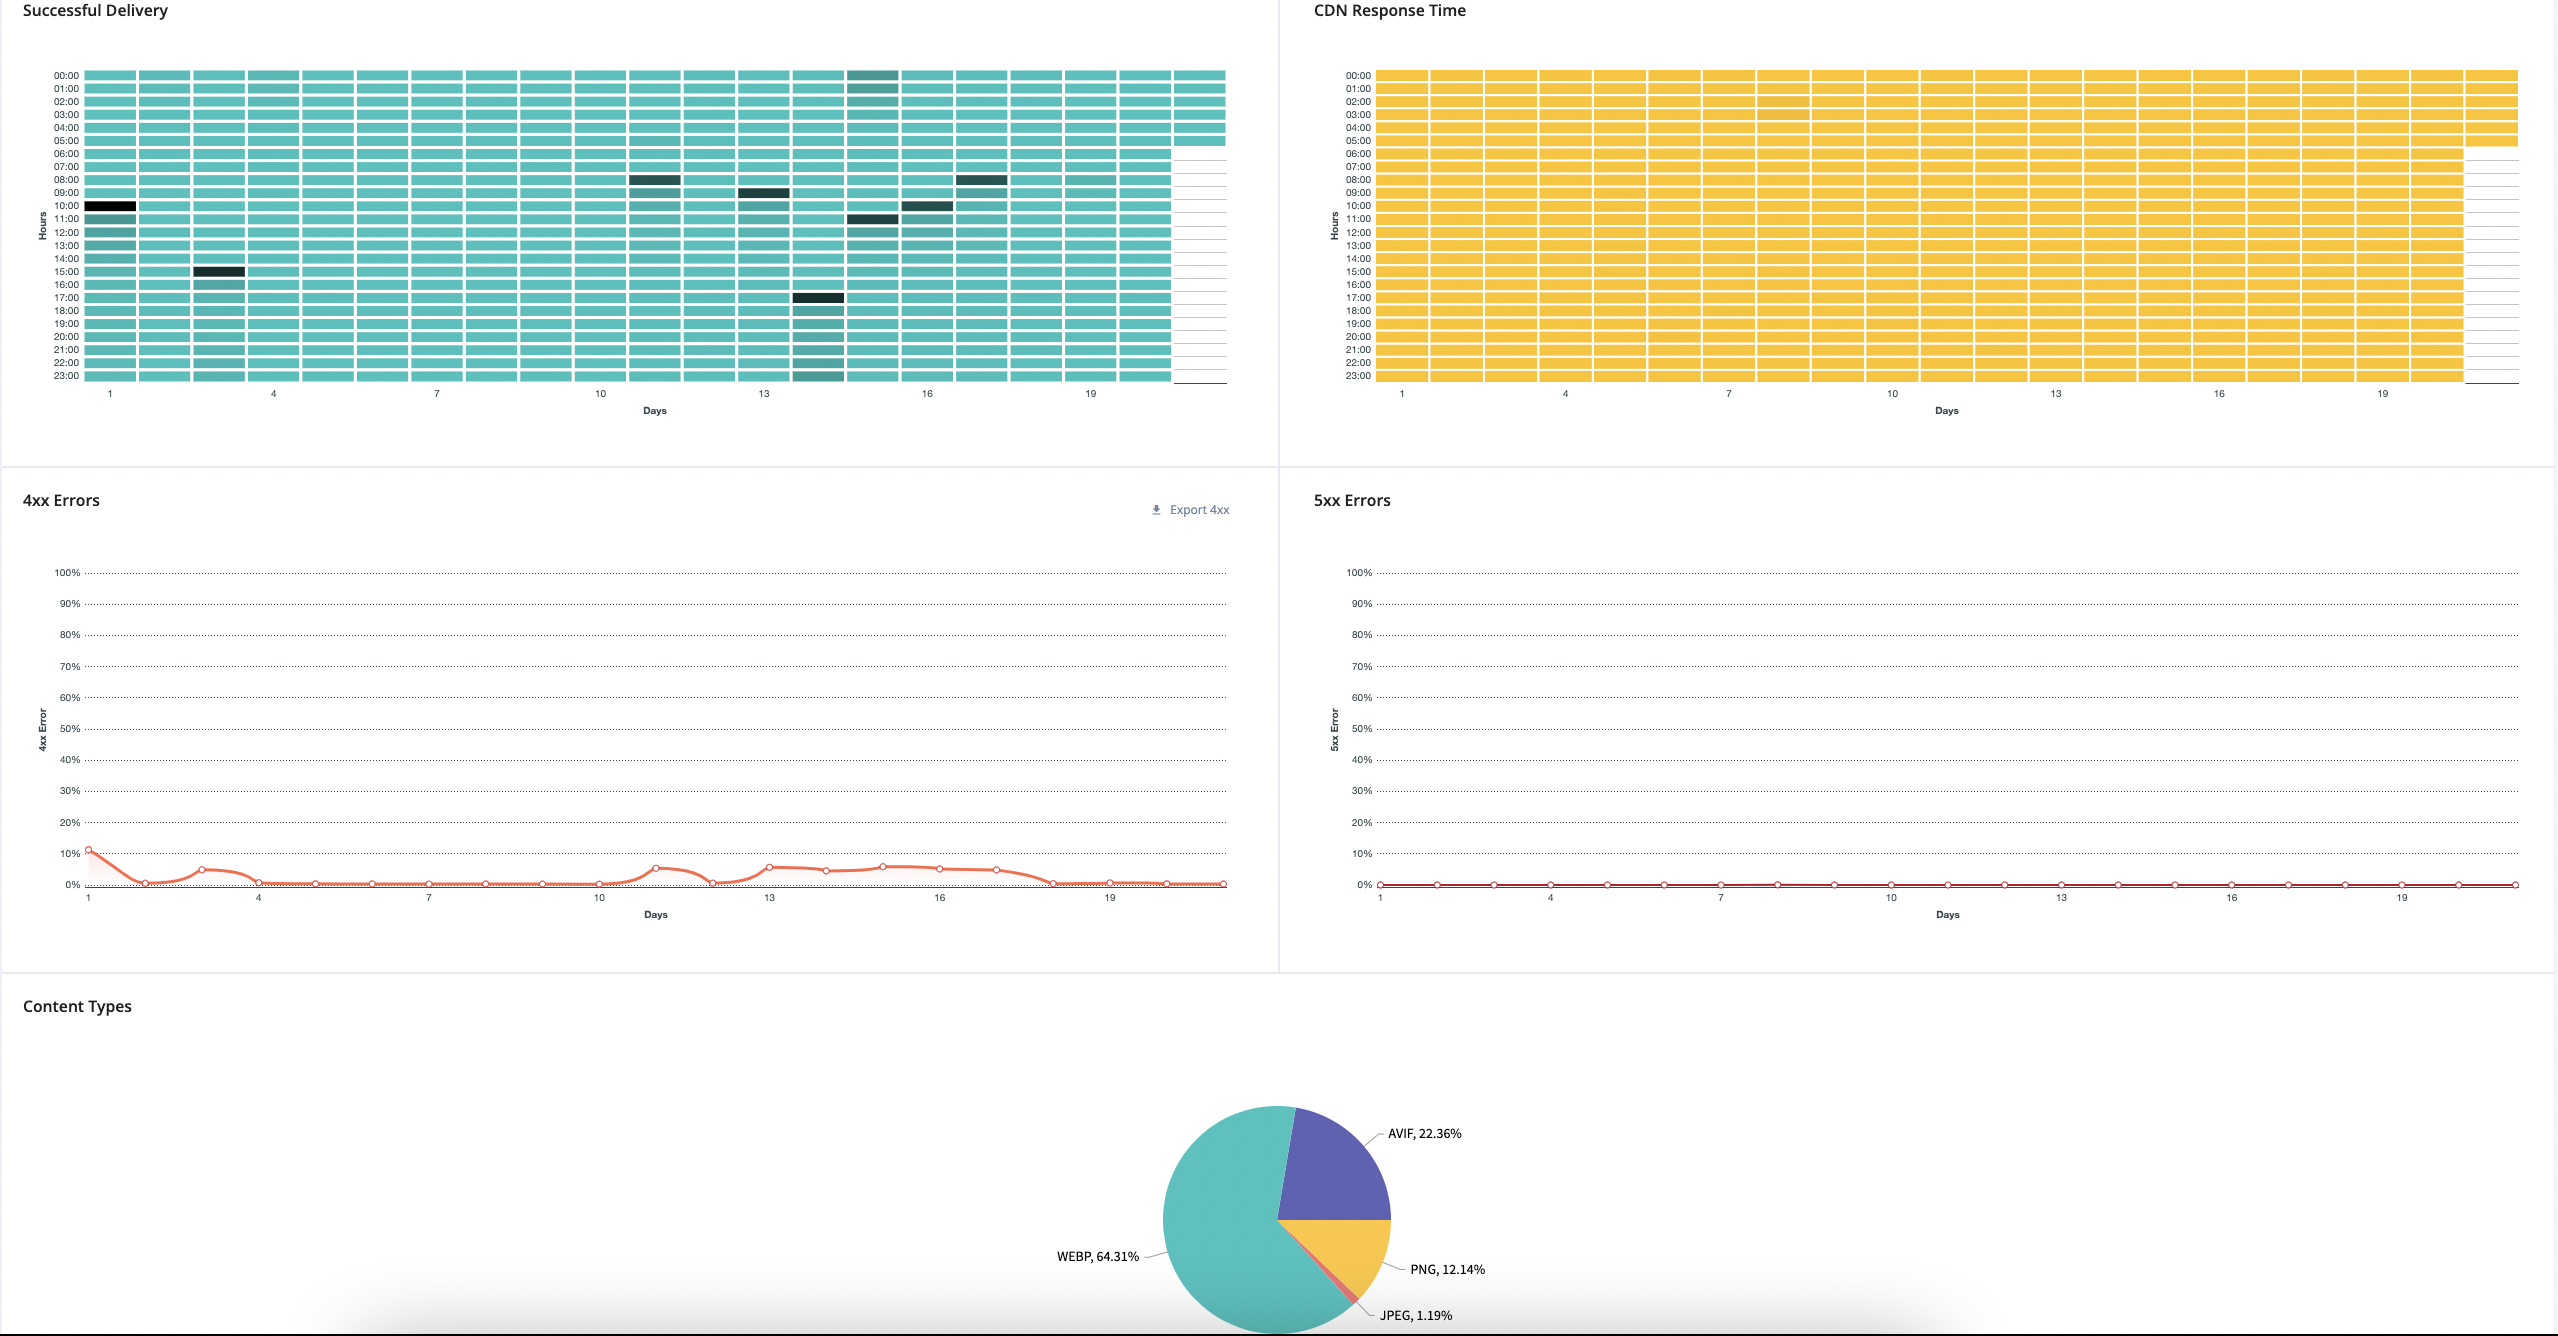
These metrics which show the performance of the CDN network.
- Successful Delivery: Indicates the percentage of successful delivery(2xx response)
- CDN Response Time: Indicates the average response time of all requests.
- 4xx Errors: Indicates the percentage of 4xx errors from the origin server while fetching the original image.
- 5xx Errors: Indicates the percentage of errors originating from Gumlet server.
- Content Types: Shows distributions of the image on content type across all responses.

Updated about 2 years ago
